Source: https://www.esri.cao.go.jp/jp/sna/data/data_list/sokuhou/files/2023/qe233/tables/gaku-jk2331.csv
By itself, it’s of little concern that GDP happened to fall back at an annual rate of 3% during July-September. Even healthy economies have down quarters. What is concerning is that GDP today is no higher than it was five years ago: in mid-2018, prior to the 2019 hike in the consumption tax and before Covid.
Of even greater concern is that, if not for a big hike in government spending, GDP today would be almost 3% lower than it was five years ago. The reason is that total private domestic demand—the combination of household consumption, business investment, and housing—is 3.0% lower today than it was in 2018 (see chart below). Compared to 2018, consumption is down 2.6%, business investment is down 3%, and housing construction is down 4.5%.
Consequently, government spending, which comprises just 26% of GDP, is responsible for virtually all the GDP growth (see chart below).
With the real yen the cheapest it has been in a half-century—putting Japan in position to cut the dollar prices its exports—one would have thought that a recovery in the trade surplus would also drive GDP growth. However, the trade surplus today is no higher than it was in the first three quarters of 2018. Near-term prospects for the trade surplus remain unclear. For one thing, the majority of Japan’s exports are capital goods and prospects for global business investment over the coming year or two remain unclear. Second is the slowdown in the Chinese economy, which buys a fifth of Japan’s exports. On the brighter side, the US, which buys another fifth of Japan’s exports, seems to be avoiding a recession in its efforts to bring down inflation and is widely predicted to grow around 2% in 2024.
The Yo-Yo Economy
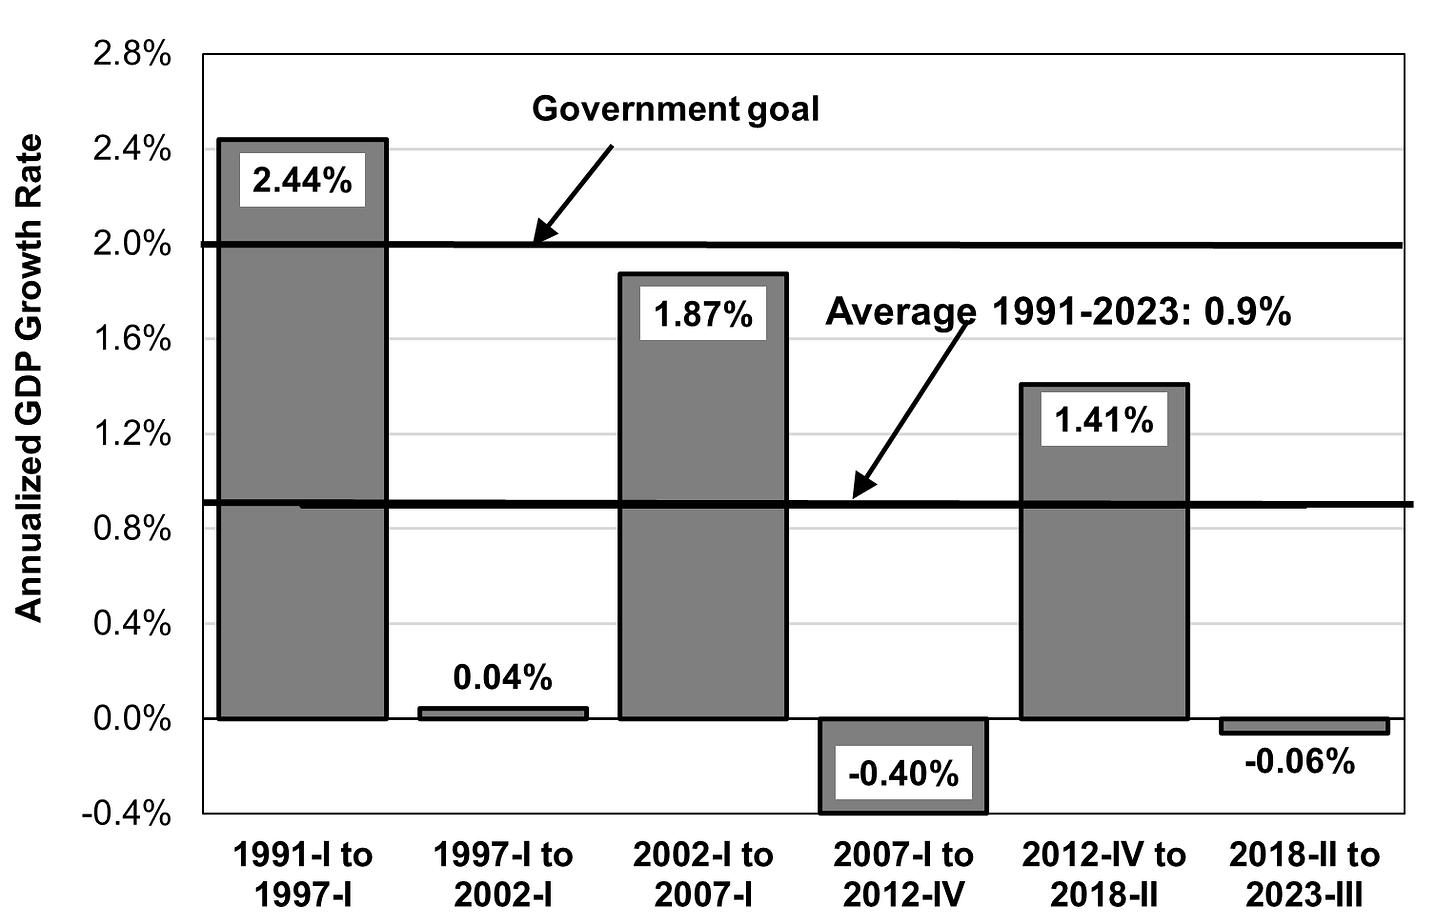
Ever since the “lost decades” began shortly after Japan’s 1990 financial and real estate crash, Japan’s economy has gone up and down like a yo-yo: 5-6 years of growth followed by 5-6 years of zero growth, or even a bit worse (see chart at the top).
One administration after another has promised voters that Japan would recover to 2% annual GDP growth. In fact, the only period at 2% or above in the last three decades was the 2.4% achieved back in 1991-97. The 2002-07 was hailed as the Koizumi recovery and that in 2012-2018 at the Abe recovery. In each case, the combination of a tax hike at home and a shock originating outside of Japan ended the bout of growth. Even in later periods of growth, Japan failed to reach even 2%, and, since those “fat” years were followed by “lean” years, average growth over the past three decades has been a mere 0.9% (see top chart again).
Stock Prices And Wages
Again and again, during the half-dozen better years, investment banks and brokers trying to get people to buy Japanese stocks have proclaimed that the long-sought recovery has finally arrived. What has really arrived is an era where profits rise because real wages are cut and a cheap yen boosts, if not exports themselves, the profits of the big exporters. Hence, the stock market is now at its highest level since the 1990s.
But what’s good for stock prices is not, in this case, good for Japan.
Real wages per company employee have been falling for several years now and, as of now, are down 2.4% from a year ago. Much of the fall is due to the inflation sparked by the cheap yen and global rise in food and energy prices. While nominal wages have been averaging an annual rise of 1.5% since the spring wage negotiation, that’s hardly enough to keep up with inflation (see chart below).
Source: https://www.esri.cao.go.jp/jp/sna/data/data_list/sokuhou/files/2023/qe233/tables/kshotoku-q2331.csv
In fact, the fall of real wages per employee has been severe enough to cause total real employee compensation to fall from 54% of GDP in the mid-1990s to just 49% these days (see chart below).
At first, I assumed that the compensation share fell because the number of employees had also fallen as a result of aging (there are 15% fewer people aged 15-64 today than there were in 1994). To my surprise, the number of company employees is up in Japan, far more than growth in the number of people employed. In 1994, there were 52 million company employees. Today, there are 61 million. Some of this is because, instead of setting up mom-and-pop shops and being self-employed, the elderly have decided to work for companies instead. A second reason is that, given the labor shortage, companies are hiring more women and seniors as non-regulars and paying them lower wages.
In any case, when you consider the drop in compensation per employee, and put that together with cutbacks in social security per senior and a decimation in in interest income, no wonder real consumption as a share of GDP has also fallen, in this case, from 55% to 53%.
What This Means For BOJ Policy And The Yen
Nominal wage growth is averaging about 1.5%, just half the 3% growth that the Bank of Japan (BOJ) says is necessary to achieve 2% inflation. In combination with uncertain prospects for growth, this means that the Bank of Japan will continue to resist pressure to raise interest rates. That, in turn, means that the yen will continue to remain weak since the gap between American and Japanese rates will remain at a high level (see chart below).
Source: https://www.wsj.com/market-data?mod=nav_top_subsection
30% book discount on a hard copy of my forthcoming book
To get a 30% discount on the hard copy of my forthcoming book on reviving entrepreneurship in Japan, see instructions on https://richardkatz.substack.com/p/30-off-for-my-book-on-japan-entrepreneurship. Pre-orders total sales help since they encourage Oxford University Press to put more effort into marketing.


