Predictions Of Yen At ¥95 Per Dollar Are Based On False Logic
“Purchasing Power Parity” Essential For Many Uses, But Not Market Forecasts
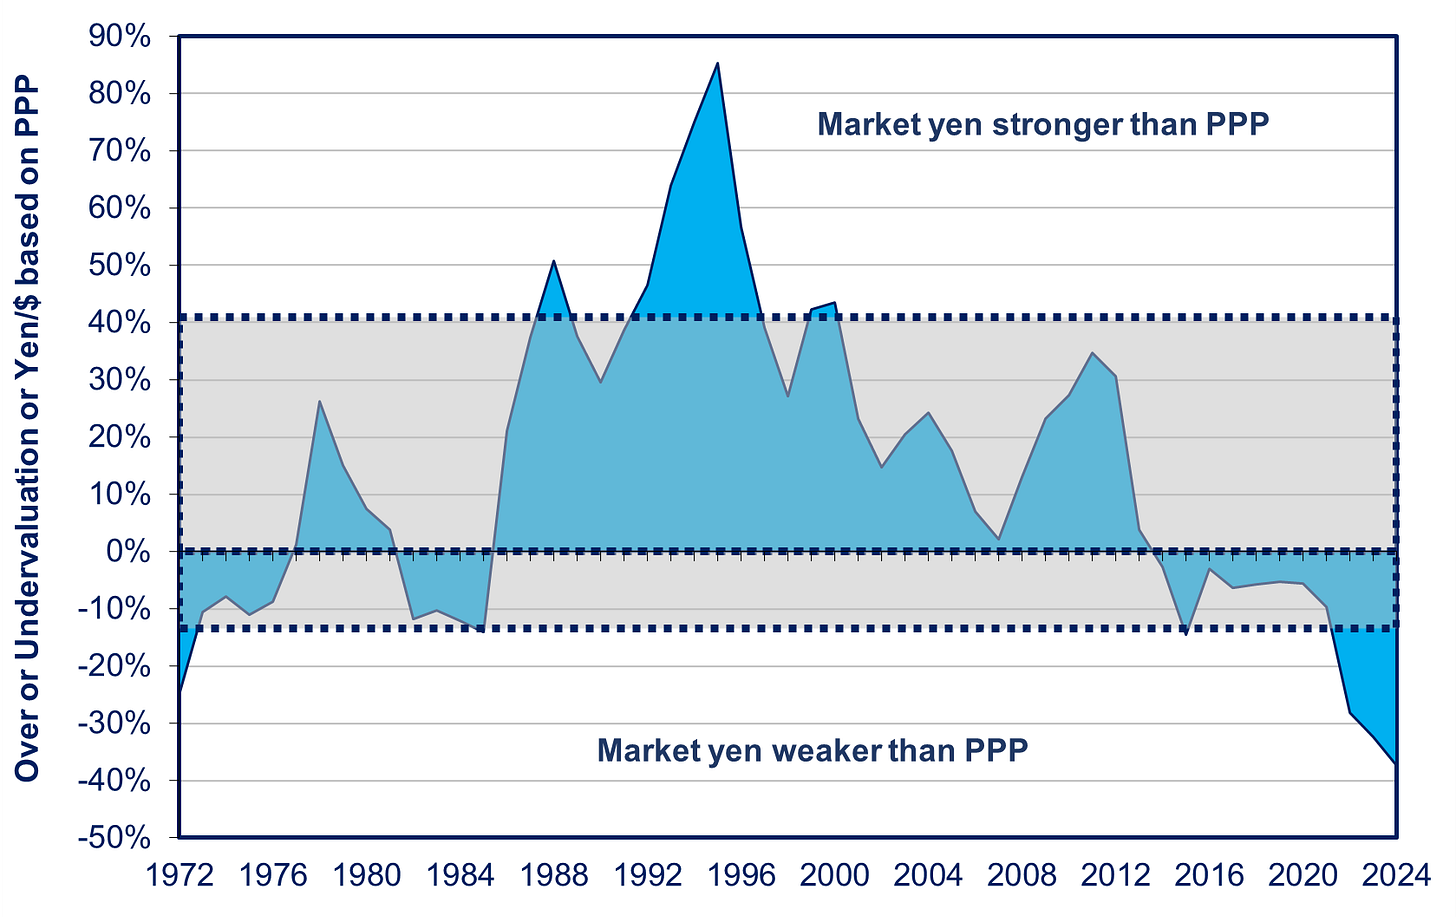
Source: https://tinyurl.com/5xnkhh5m Note: Yen axis is inverted so that a smaller number means a stronger yen; see text for explanation of Purchasing Power Parity (PPP)
Believe it or not, some serious economists argue that the yen “should” be worth ¥95/$, and therefore, that’s where the market value of the yen will eventually have to move toward. I think this view is wrong. Why it’s wrong sheds some light on the dynamics driving the yen’s market value. At the same time, it sheds light on how Japan stacks up against other countries in terms of per capita GDP, productivity, and living standards. This makes the issue worth discussing.
Why Does “Purchasing Power Parity” See The Yen at ¥95/$?
¥95 is the value that the OECD and others calculate is the yen’s so-called “purchasing power parity” (PPP) value. But, as I’ll detail below, a currency’s PPP value has nothing to do with its market value.
To explain PPP, let’s start with the Economist’s famous “Big Mac” index. This is a measure of what the value of the yen (or any other currency) would have to be for the price of a Big Mac to be the same in Japan (or any other country) as in the US. In July 2024, the market value of the yen averaged ¥158/$. As a result, a Big Mac priced at ¥557 in Japan cost $3.53 in dollars as opposed to $5.69 in the US. For the price in Japan to be equivalent to $5.69, the yen would have to trade at ¥97/$. By this standard, the yen was “undervalued” by 38%. Now, apply the same method to all of GDP. For the price of energy and cars, homes and office buildings, haircuts, and movie tickets to average the same in both countries, the yen would have to be ¥95/$ these days (see chart at the top). That ¥95 level is called the Purchasing Power Parity, meaning that $1.00 and ¥95 could each buy the same amount of goods and services in each country.
While PPP is the “gold standard” for comparing living standards and productivity in different countries, PPP and a currency’s market value measure very different things, as I’ll explain later. To conflate the two is like saying that chuck steak and filet mignon should cost the same just because they weigh the same.
Not surprisingly, then, PPP is a terrible forecaster of the actual market price of the yen, the euro, and other currencies. Take a gander at the chart at the top. Over the past four decades, the PPP value almost doubled. Whereas in 1988, it took nearly 200 yen to buy the same amount of goods and services as a dollar, now it takes less than 100 yen. By contrast, during the same period, the market value of the yen fluctuated over a wide range and is now even weaker than in 1988.
In fact, over the past half-century, the yen/$ has averaged 14% above its PPP value. But it gyrated wildly around that average. In two-thirds of the years, the market value of the yen ranged from 14% weaker than the PPP value to 40% stronger (this is the range shown in the shaded area between the two dotted lines in the chart below). Any trader who bet on the yen’s market value heading toward the PPP value would have gone bankrupt.
Note: The blue area shows how much stronger or weaker the yen was compared to its PPP value. The shaded area between the dotted lines shows the “standard deviation,” the range where the difference between market and PPP value was two-thirds of the time.
It’s not just the yen where PPP is a terrible predictor. The same is true of the euro and most other currencies (for the euro, see chart below)
Note: Euro/$ axis is inverted so a smaller number means a stronger euro
What PPP Measures and Why It’s So Important—For Some Purposes
If PPP is such a lousy predictor of a currency’s market value, why do economists use it? It’s because PPP is an essential tool for comparing the size of GDP, living standards, and productivity in different countries. It eliminates all sorts of distortions that show up if we use market values to compare these fundamental metrics across countries.
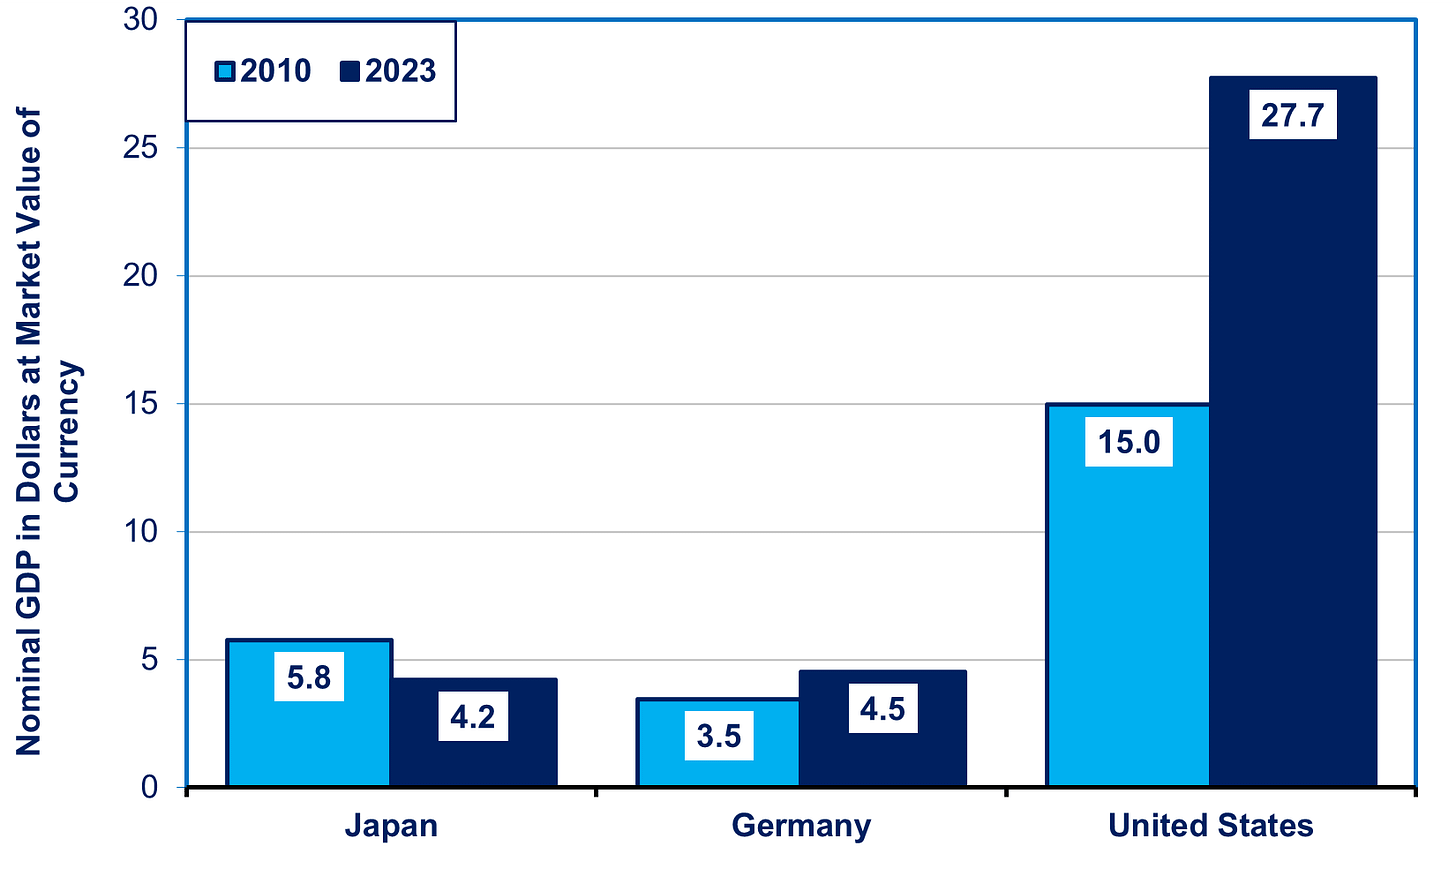
A year ago, it made headlines when Japan fell behind Germany in nominal GDP and thus appeared to drop in rank to the fourth largest economy in the world. As I wrote then, this was a meaningless way to measure Japan’s economic strength, a change almost entirely due to the yen's depreciation. From 2010 to 2023, the market value of the yen fell by nearly 40%, from ¥88 to ¥140. If we use that change to convert Japan’s nominal GDP to dollars, we’d end up claiming that Japan’s GDP fell by more than a quarter—from $5.8 trillion to $4.2 trillion--while Germany’s rose by 30% and America’s soared by 85% (see chart below). We’d also have to say there was a similar 25% drop in per capita GDP and wages. That’s the kind of plunge in real (price-adjusted) terms that the world suffered in the 1930s Depression. Of course, the Japanese economy suffered no such catastrophe. PPP eliminates such currency distortions
.Source: https://www.imf.org/-/media/Files/Publications/WEO/WEO-Database/2024/October/WEOOct2024all.ashx
Similarly, suppose that, in nominal dollar terms, wages in country X were twice as high as in Japan. Some would say living standards there were thus twice as high as in Japan. But suppose prices in country X were triple those in Japan. In that case, real (price-adjusted) personal income would actually be lower than in Japan. PPP also eliminates the distortions caused by differing price levels and by different rates of inflation and deflation. Another way to look at PPP analysis is this: how many hours does the average worker in assorted countries have to work to buy an identical basket of products?
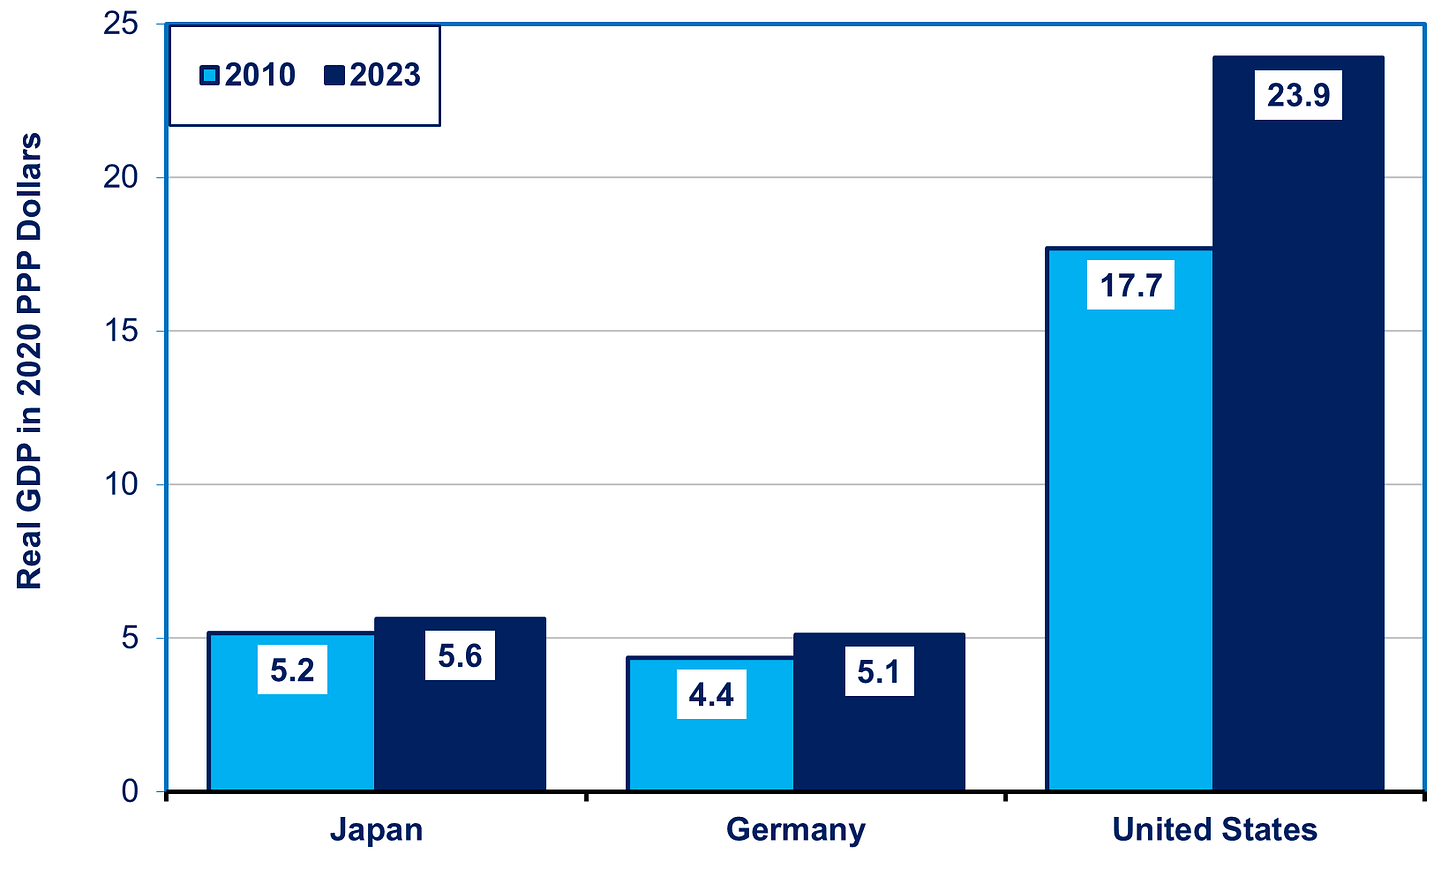
Once we use PPP to adjust for fluctuating currency values and price trends, we can do a proper comparison of real economic fundamentals. As we can see in the chart below, total real GDP rose in all three countries, but most slowly in Japan. Japan’s GDP was still larger than Germany's—mainly because it has a much larger labor force. Still, while Japan’s real GDP was 18% larger than Germany's in 2010, by 2023, it was only 10% larger. In 2010, Japan’s GDP was 29% as large as that of the US; by 2023, it was only 24% as large.
Source: https://data-explorer.oecd.org/
Using PPP To Compare Productivity and Living Standards
What matters most for living standards is not total GDP but GDP per person, productivity (GDP per work-hour), and real personal income and wages. The chart below shows how Japan, having spent decades in the postwar era catching up toward US levels, is now falling back. This shows the richness of PPP analysis both for any given point in time and over time. For example, productivity fell from 68% of the US level in 2010 to just 61% in 2023; real wages per hour fell from 75% of the US level to just 58%.
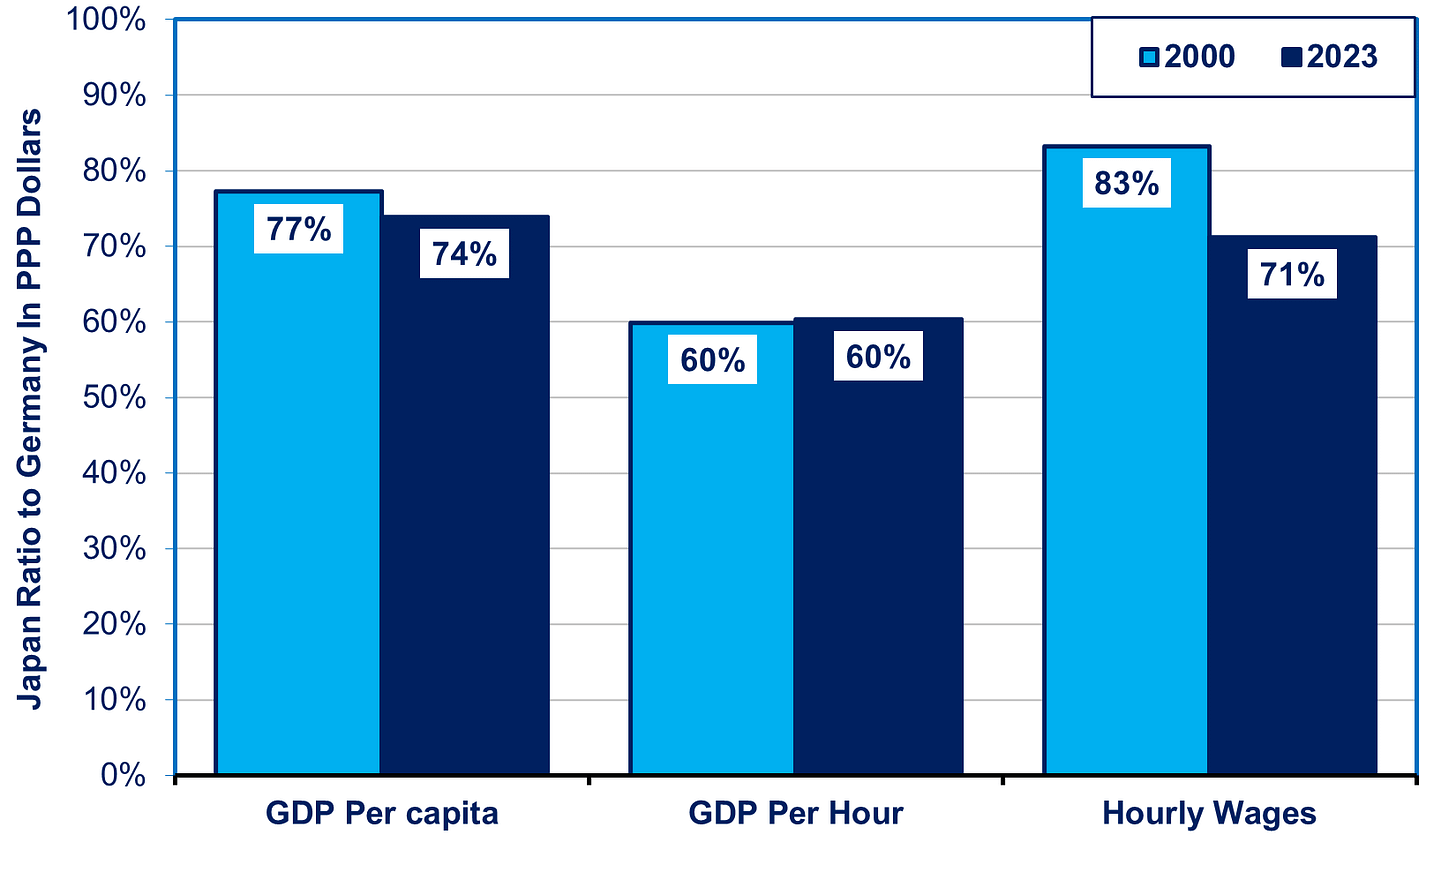
The chart below shows the same comparison between Japan and Germany. These two countries performed similarly in per capita GDP and productivity, but Germany shared more of the fruits of growth with the workers who produced its GDP. Being able to examine how these assorted barometers of economic performance differ shows the ability of PPP analysis to do a “deep dive.”
How PPP Aids Macroeconomic Analysis
Here’s another way PPP analysis sheds light on Japan’s economic patterns. For example, it illuminates why Japan has become addicted to budget deficits.
In textbook economics, wages per worker should grow in tandem with output per worker. This has been the case for most of the past couple of centuries in most industrial countries. But not so over the past few decades. When wages fall behind productivity growth, macroeconomic theory, as well as history, teaches us that this leads to all sorts of macroeconomic instabilities, as well as political repercussions. That’s one of the background reasons for the rise in rightwing populism in North America and Europe.
Japan has the worst gap between growth in productivity (real GDP per hour) and in average real wages per hour. Despite substantial increases in output per hour, wages have stayed virtually flat for almost a quarter century. (For more on this wage-productivity gap, see this past post.
)Note: Productivity means real GDP per hour; wages mean real wages per hour
One of the macroeconomic consequences of wage suppression is this: if worker purchasing power lags, who will buy all of the products that companies produce? To solve this problem, countries end up relying on budget deficits and growing trade surpluses to be the “buyer of last resort.” (For more on how wage suppression turned Japan into a deficit addict, see this post.)
One other thing to note is the similarity between Japan and Germany in productivity growth. As it turns out, Germany suffers from many of the same economic problems as Japan, which will be the subject of a future blog post.
Coming in Part II
PPP and the market value of the yen measure very different entities. PPP is a measuring rod enabling us to compare economic fundamentals in different countries. The market value of a currency, by contrast, is a price, the result of supply and demand in the international market for goods and services as well as financial transactions. PPP is based on all of GDP, most of which does not trade internationally. Moreover, PPP does not include financial transactions, and thus fails to factor in the gap in US and Japanese interests rates, which has been so pivotal to the yen’s market value for most of the past couple decades. That’s why the yen’s market value has fallen even as its PPP measure has risen. Details in Part II.
To receive new posts and support my work, consider becoming a free or paid subscriber.
To provide more support, donate several subs at $50 each. You do not need to name the sub recipients, just how many. This is a one-time contribution; it does not repeat automatically. Please click the button below.


Thank you for clarifying this important distinction. It gives new meaning to the phrase "it's all relative."