Trade Surplus Provided All of Japan’s GDP Growth in 2nd Quarter
Consumption Shrank While Business Investment Was Flat
Source: https://www.esri.cao.go.jp/jp/sna/data/data_list/sokuhou/files/2023/qe232/tables/gaku-jk2321.csv
The headline number sounded great. Japan grew at a 6% annual rate during the April-June quarter, twice as much as economists expected. Moreover, GDP is finally higher than it was back in 2018. Some have hailed this as a burst of new resilience. Unfortunately, one swallow does not a spring make, especially not in this case.
A look inside the numbers suggests that this particular swallow does not herald more to come. 100% of Japan’s growth was provided by an expansion of the trade surplus, 60% of which was due to a decline in imports rather than an expansion of exports.
With the trade surplus rarely more than a few percent of GDP, it cannot lift the economy by itself for more than a short burst. Plus, it remains to be seen what will happen to the surplus in the coming quarters.
Meanwhile, consumption, which amounts to half of the economy, shrank at a 2.1% annual rate. If not for trade, this decline would have lowered overall GDP by 1.1%. Business investment barely rose at all—just a 0.1% rise on an annual basis, the size of a rounding error (caution: the investment number is a preliminary estimate and may change when revised numbers come out in a few weeks). Total private demand—consumption, business investment, and housing combined—fell by 2.0%. So, if not for trade and government spending, GDP would have fallen. In fact, private demand today is only 1% higher than it was a decade ago in 2013! (see chart at the top). Since private demand accounts for almost three-quarters of the entire economy, no wonder GDP growth per year has averaged only 0.5% a year since early 2014 when Shinzo Abe’s first consumption tax hike was introduced.
Ultimately, the purpose of an economy is not just to produce higher GDP numbers, but to raise the living standards of the population. Hence, it’s a problem when GDP grows but it does not produce hikes in personal consumption. In Japan, consumption is 2.5% below where it was a decade ago (see chart below). Moreover, GDP cannot grow well for long if consumer spending is not growing.
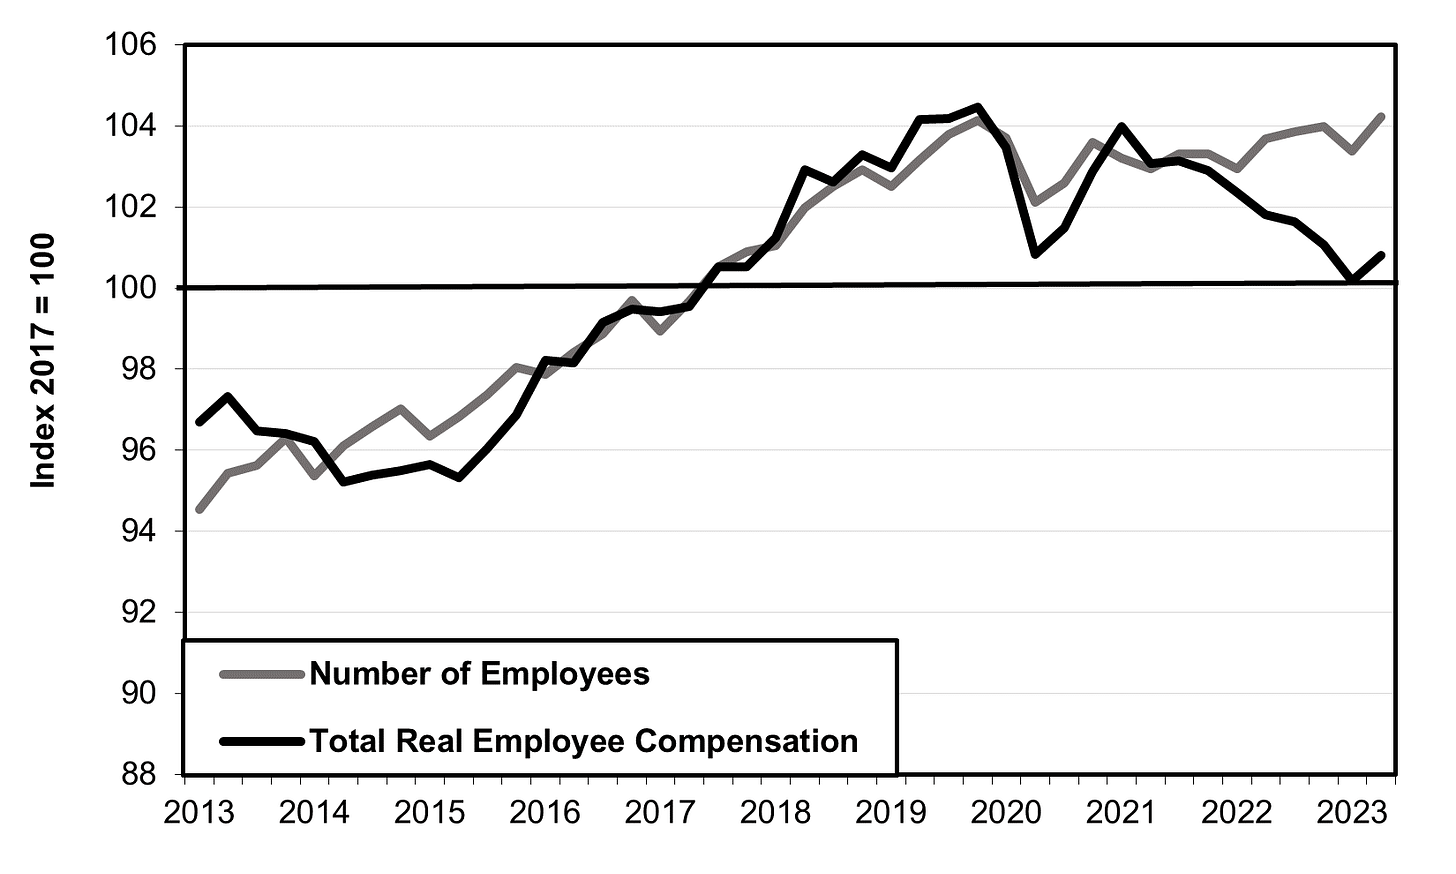
GDP growth is anemic because consumption is anemic, and consumer spending is anemic because household income is anemic. We don’t have the latest figures for overall income, but real (price-adjusted) compensation for all employees combined is flat and that is why consumption is flat (see chart below).
Source: https://www.esri.cao.go.jp/jp/sna/data/data_list/sokuhou/files/2023/qe232/tables/kshotoku-q2321.csv
Worse yet, real employee compensation is still below the level it reached prior to Covid and just 0.8% higher than it was six years ago back in 2017, even though the number of employees is 4.2% higher than it was back in 2017. In other words, real (price-adjusted) compensation per employee is down 3.4% from six years ago (see chart below).
Source: https://www.stat.go.jp/data/roudou/longtime/zuhyou/lt01-b30.xlsx
These figures add up to signs of classic short-term burst, of the type we’ve seen for the past three decades, not the signs of a turnaround. Beware of those making a rush to judgment.


thank you for this. Headlines don’t often tell the story.
Thanks for sharing your insights. I knew that there had to be catch when I saw the headlines. The devil in the details again!