Company Ability to Use Technology Deteriorating, Part I
50 Top Japanese Companies Match World’s Best; Rest Lag Far Behind
Source: Mizuho Research Inst. https://tinyurl.com/preview/2c6a5glu Note: GF means Global Frontier companies; includes manufacturers listed on the stock market; Total Factor Productivity, natural logs, see text for further explanation
Not until three or four decades after Thomas Edison set up his first electric power plant in 1881 and started selling electric motors to factories in 1882 did electricity do much for hiking manufacturing productivity in the US. The problem was that factory layouts had been designed around a single in-house centralized steam engine and just replacing that steam engine with electricity made little difference. It took decades for managers to figure out that machines and workers operated so much more efficiently with better-trained workers laboring with separate motorized machines on an assembly line, all powered by electricity from a utility miles away. Moreover, the machines and the electric motors each had to be designed with the other in mind. In short, to exploit electricity, companies had to re engineer the factory (https://www.bbc.com/news/business-40673694). Ford’s Model T would have been impossible without electrification (https://www.thehenryford.org/collections-and-research/digital-collections/artifact/167313. Once managers figured this out, electrification caused US factory productivity—output per person-hour—to zoom in the 1920s faster than at any time before or since. Once Edison pioneered electric motors for factories and Henry Ford pioneered the assembly line, any other company in any country could adopt the same technology. That’s what mattered for growth.
A similar thing happened with computers; in 1987, Robert Solow, who invented modern growth theory, quipped: “You can see the computer age everywhere but in the productivity statistics.” They showed up in the statistics a decade later as firms realized that to take best advantage of the computer and Internet, they had to re-engineer the firm itself. Two-thirds of the acceleration in US productivity beginning in the mid-1990s came not from the so-called “new economy” sectors of information and communication but from “old economy” sectors from retail to rust belt factories. Not in the sectors producing the latest technology, but in those consuming it.
There’s a lesson in this for Japan. Leaders in government and business who see the deterioration of the country’s commercial innovation believe the answer lies in funding more basic and applied research. That is part of the answer, as I discussed in this post, this post, and this one. However, by itself, more research won’t solve the problem. In a world where technology is for sale across borders, it matters less which country creates new technologies than which countries host lots of companies that are able to understand the science and exploit those innovations. Japan is a big laggard on this front. The poster child for this syndrome, as I’ve mentioned many times, is that Japan comes in last among 64 countries in terms of how much benefit in sales and profits its firms get for each dollar they invest in digital technologies.
Follow the Leader
It typically takes many years, even decades, for a technology to diffuse so that most companies use it. Initially, companies at the global frontier adopt these innovations, then companies at each nation’s technological frontier, and then other companies within a given country. Perhaps because laggards within a country have less international exposure via trade or direct investment, they tend to follow their national leaders more than the global frontier companies.
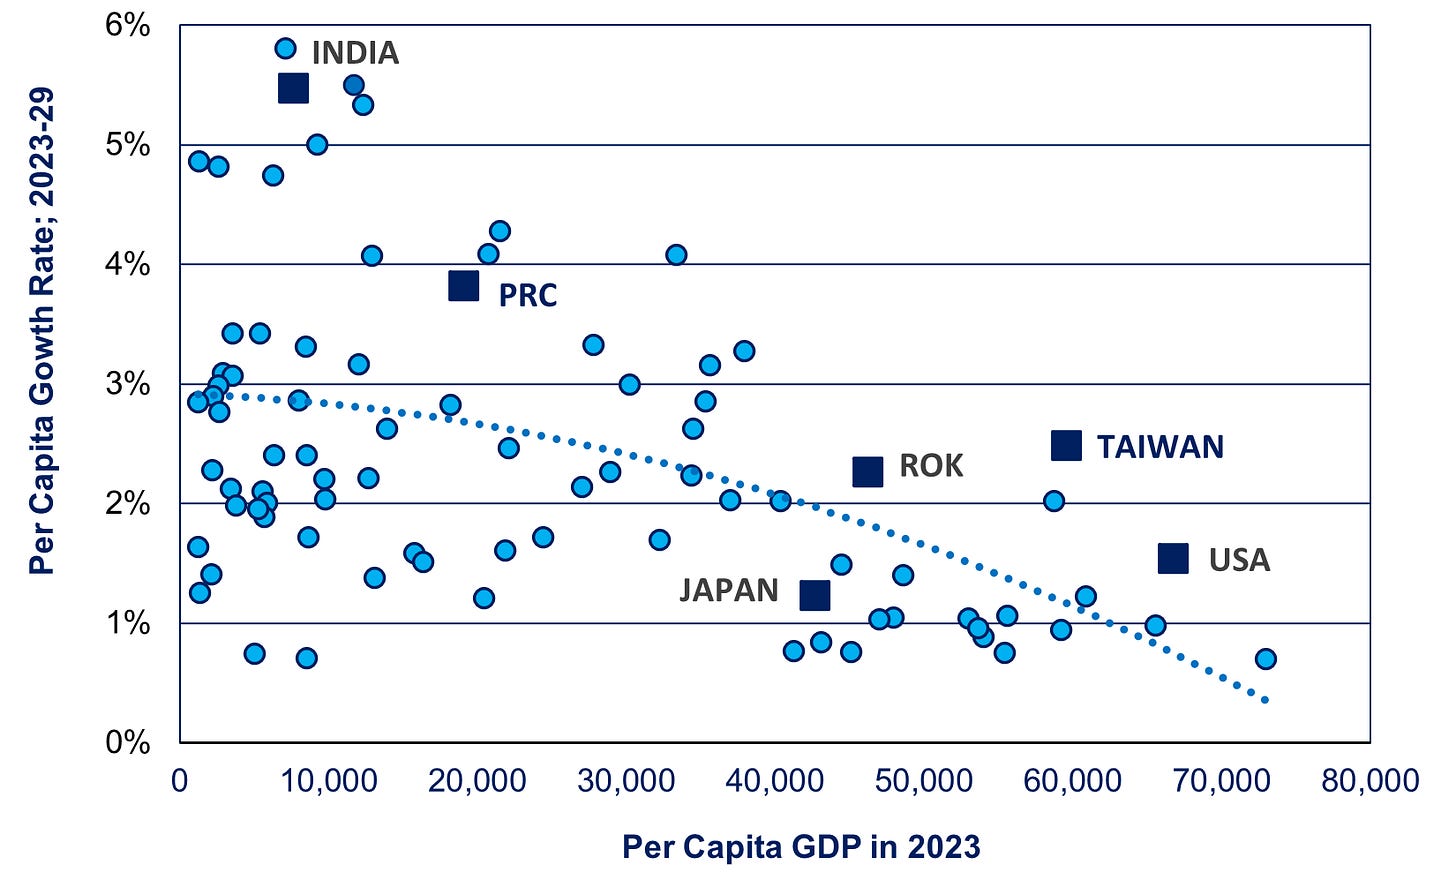
On average, it is the countries and companies with the largest productivity gap with the global frontier companies that show the fastest growth in productivity as they catch up. An OECD study compared labor productivity in 60 countries to the US level during 1950-2013. On average, the catch-up process added 3% a year to growth in labor productivity in the average country. Moreover, for every one percentage point gap in a country’s labor productivity compared to the US level, its own labor productivity rises by 0.065% per year over a five-year period. Hence, if a country’s productivity were 80% below that of the US, as Japan was in 1950, that would add 5.2% percentage points to its own annual productivity growth. This is why poorer countries on the catch-up path grow faster than those closer to the richest countries (see chart below).
Source: IMF forecast at https://www.imf.org/en/Publications/WEO/weo-database/2022/October/select-aggr-data Note: Includes 83 countries with at least 5 million people, at least 0.5% growth, and no major oil exporters
There are several mechanisms driving catch-up. A lot of technology is embodied in modern machinery. Just by constructing a more modern steel mill, or numerically-controlled machine tools, or using the Internet for e-commerce, or cell phones, a country can give a big boost to its GDP per work-hour. Another mechanism is direct interaction with leading firms. As companies in less affluent countries trade with firms in richer ones or accept more inward foreign direct investment, they learn all sorts of things from their customers and suppliers or the multinational firms operating in their countries. Thirdly, as countries get richer and can afford to devote more of their GDP to R&D, much of that R&D will be devoted to adapting the most modern technology in the world to the conditions of their firms in their country.
Still, the catch-up is not automatic. You can see in the chart above there’s a considerable variation in growth rates among countries on the catch-up path. Japan used to be far above the overall trend line; now it’s far below. Korea, on the other hand, is still above it. And China under Xi Jinping is no longer off the charts, as it was only a decade ago.
Japan Falling Behind In Its Catchup Effort
In the high-growth era, Japan outdid all of its predecessors in the catchup process. Per capita GDP increased fivefold from a level that, in 1953, was the same as a poor African country today. By 1971, 40% of all industrial output consisted of products—from color TVs to petrochemicals to air conditioners—that had not existed in the Japanese market in 1951; 10% of output consisted of products that hadn’t even been invented five years earlier. Moreover, Japanese firms were exceptional at taking technologies invented elsewhere and using them to produce mass-market products—from transistor radios to laptop computers—that the inventors of the technology had never even considered (for details on this, see Chapter One of my book, The Contest For Japan’s Economic Future).
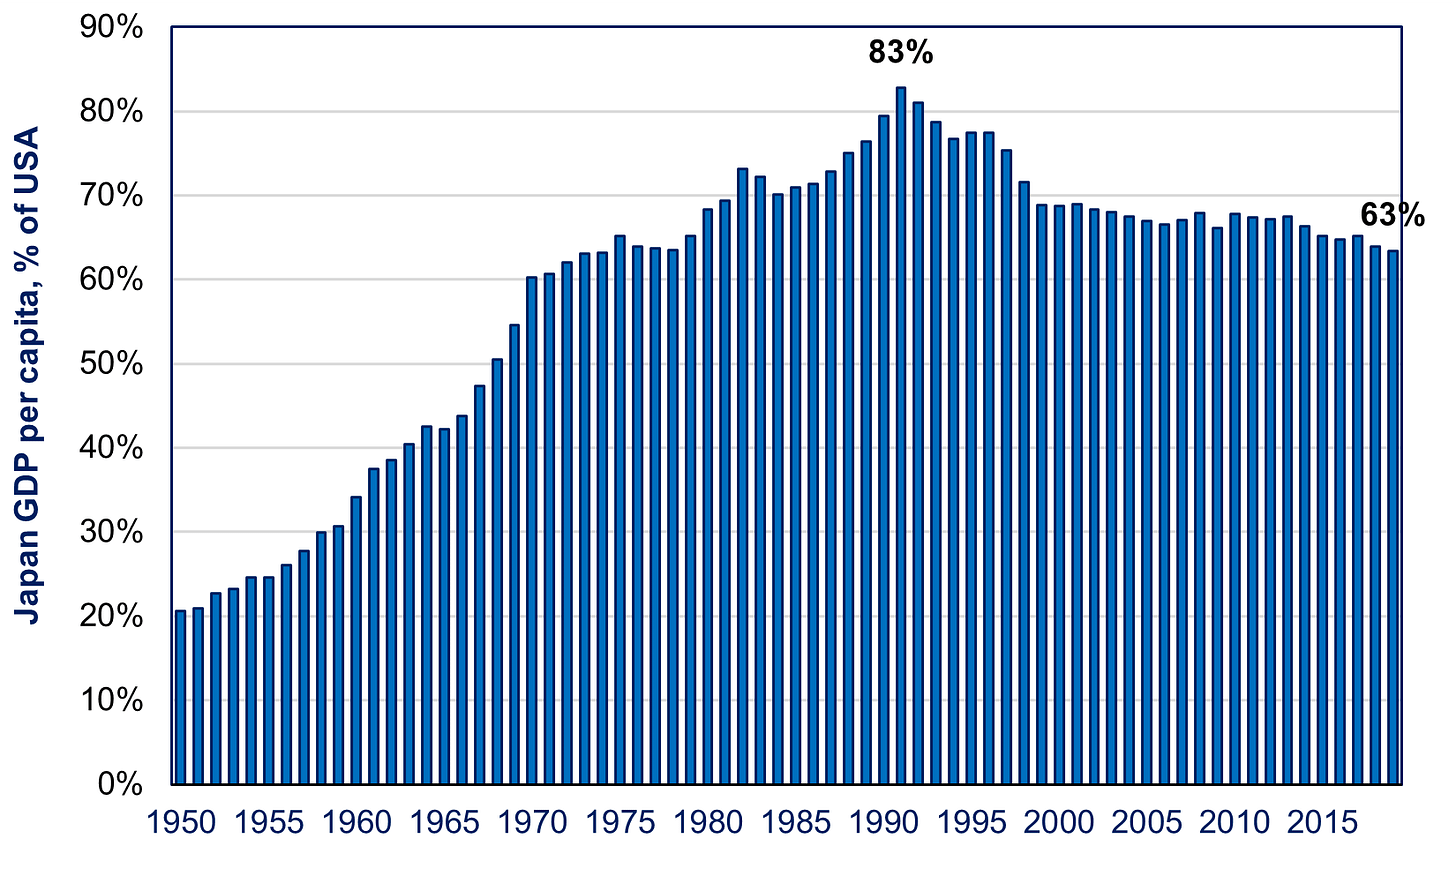
However, for reasons to be detailed in the next installment, the typical Japanese firm lost its ability to learn from others. This is why—after catching up toward American levels of per capita GDP from 1950 to 1990—Japan fell back during the following three lost decades (see chart below).
Source: Penn World Tables https://dataverse.nl/api/access/datafile/354095
In 2015, the Mizuho Research Institute put out a study showing a growing productivity gap between Japan’s leading manufacturing companies and global frontier companies from 1999 to 2009. Global frontier companies are the top 50 companies in each sub-sector of manufacturing in the OECD. The measure is how much output they can produce for all they invest in both labor and capital (a measure called Total Factor Productivity or TFP). Rather than measuring how many new inventions they make, it shows how well they use all the inventions made by themselves or others. All the companies in the study are listed in the stock market. The average number of each year's sample is 667 Japanese companies, 1,448 American firms, and 740 others in the OECD. As we can see in the chart at the top of this posting, America’s listed corporations are keeping up with the global frontier companies, while Japanese companies are falling severely behind. Companies in other countries are also falling behind the global frontier, but nowhere to the same degree as those in Japan (for more on this, see Chapter 2 of The Contest For Japan’s Economic Future).
The Bank of Japan (BOJ) found similar trends but added a significant wrinkle. It compared Japan’s own national frontier companies to the global frontier companies. It divided the leading manufacturers on Japan’s stock market into three groups: the 5% of companies with the highest TFP (about 50 companies), the next 90%, and the bottom 5%. Japan’s top 50 matched the productivity of the Global Frontier companies. However, the next 90% fell far below the level of both the global and national frontier companies. So, almost all of the companies on Japan’s stock market were underperforming (see chart).
Source: Bank of Japan at https://tinyurl.com/ybqvkhp
This is why Japan’s listed companies fell behind those in the US and the rest of the OECD
. It’s not that the laggards failed to improve their TFP, but they did so much more slowly than the frontier firms.
In an update to 2022, the BOJ showed that the gap between Japan’s own frontier companies and the rest of its listed companies had grown even larger in terms of both labor productivity and TFP.
Source: https://tinyurl.com/4ubnn3ry
If companies on the stock market—presumably Japan’s best—lag so much, what about the 2 million small and medium enterprises (SMEs) who would need to emulate the national frontier companies and who employ the lion’s share of Japan’s workers? Compared to other countries, Japan’s SMEs show the biggest gap in productivity between themselves and their larger counterparts. When we compared labor productivity in manufacturing companies with 10-250 workers to those with more than 250, Japan comes in 22nd out of 24 OECD countries (see chart below).
Source: OECD at http://dx.doi.org/10.1787/888933563474
In short, it is company shortfalls in absorbing the world’s technology that is the primary reason Japan’s per capita GDP is steadily falling behind the level seen in the US and Europe, why the catch-up process has gone into reverse.
It is certainly necessary to improve Japan’s capacity to generate new knowledge, but this will not lift the economy unless policymakers in government and business also focus on improving companies’ absorption capacity. Why Japan’s companies have lost their previous ability to exploit global innovations is the subject of the next installment.
On some days on amazon.co.jp


Fascinating analysis, Richard. I am looking forward to reading Part 2.