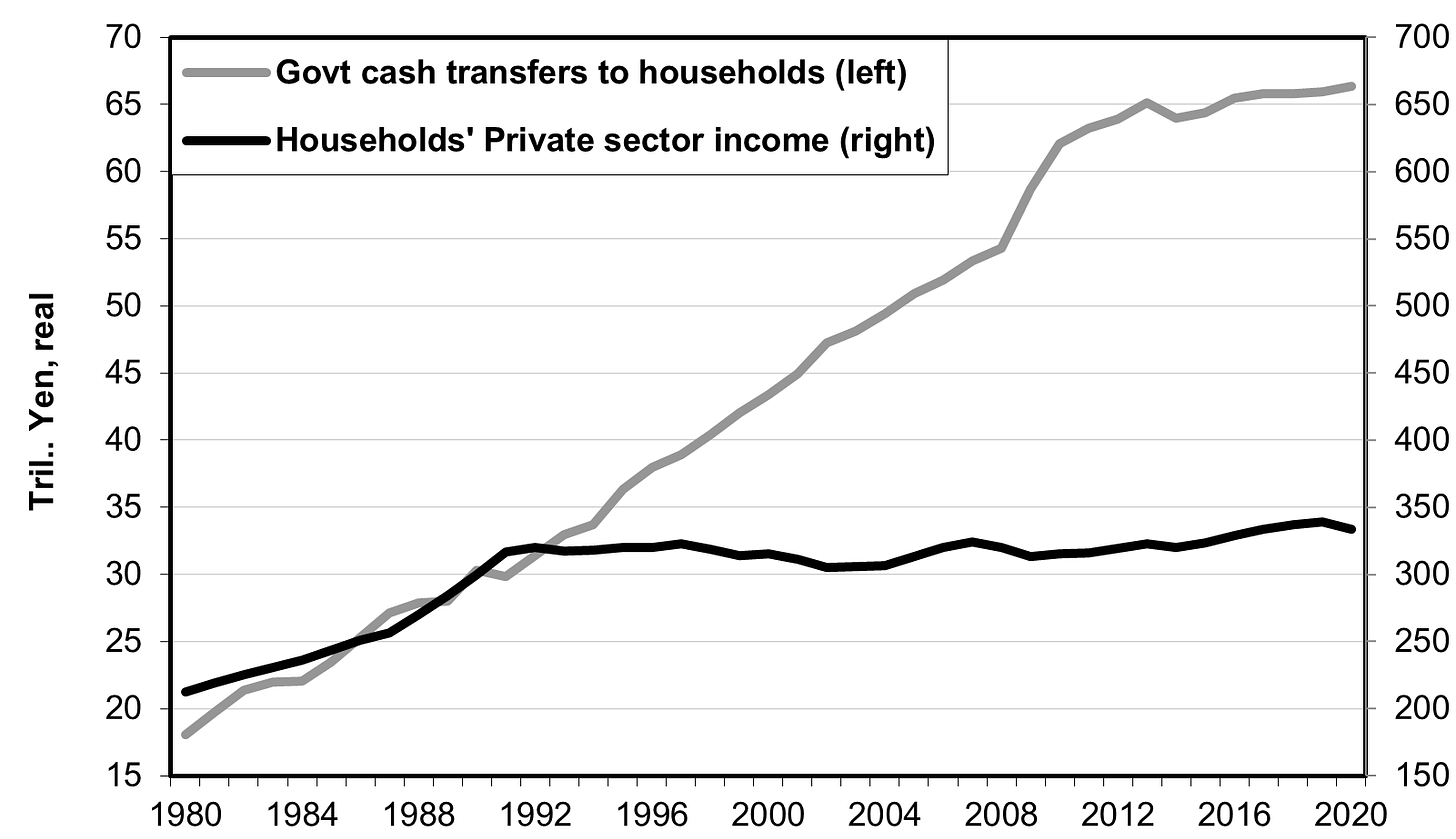
Sources of income for households; see text below for explanation
In response to my blog of yesterday, a reader wrote:
Richard, you mention in Japan “...households suffer from insufficient income, and with consumer spending so weak...” but when you look at other Asian countries and the EU...household spending as % of GDP seems fairly high and in line.
HK 62.8%
Japan 54.6%
EU 52.1%
South Korea 48.5%
China 38.5%
Singapore 36.3%
I welcome this sort of dialogue and think this one merits a longer response since the issue is so critical to Japan’s economic prospects. These numbers are correct, but they need context.
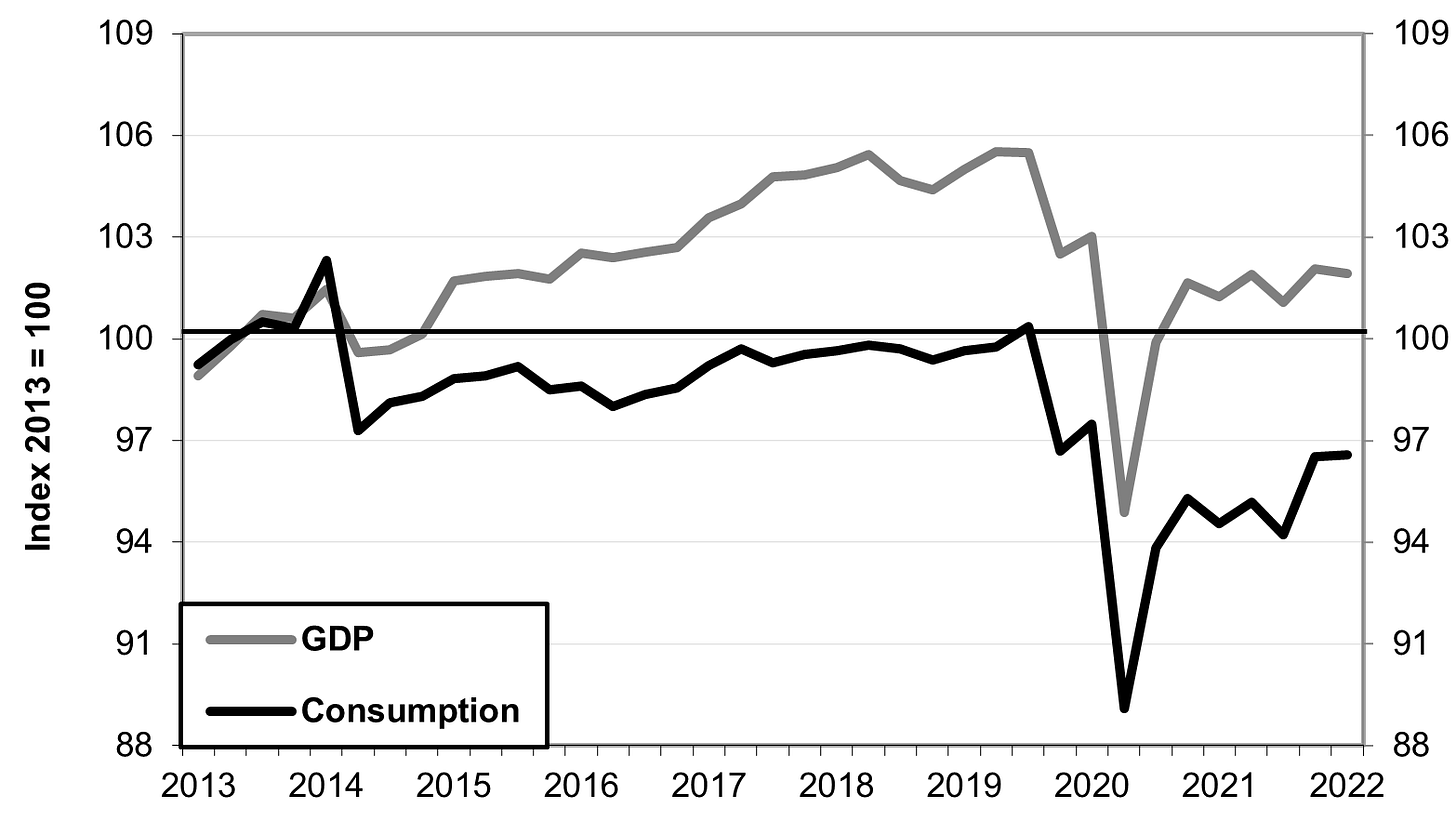
Firstly, the consumption share of real GDP fell by about 3 percentage points from the 1980s to the average of the lost decades: from about 54.6% to 53.6%. That may not sound like a lot but it’s equivalent to a good-sized recession. In fact, as we’ll see shortly, had the government not engaged in more deficit spending to make up the shortfall, consumption would have barely grown at all. Moreover, during the period of the two consumption tax hikes (2014 and 2019), real consumption more or less stopped growing and ended 2019 at a level 3 points below the 2013 level. This does not even count the impact of COVID. While GDP today is about 2% above its 2013 level, consumption is 3.4% below it (see chart below).
At least as important is how this consumption was financed. During 1980-92, 85% of households’ income growth was financed by growth in private sector income: wages, self-employed income, rents, dividends, interest, private pensions, and insurance annuities. Only 15% came from growth in government transfers of cash, like social security, welfare, and other forms of social assistance. While private-sector income grew 50% during the 12 years from 1980 to 1992, it grew only 6% in the following 28 years through 2020. By contrast, during the lost decades, deficit-funded social assistance more than doubled. As a result, only 28% of the growth in household income since 1992 has come came from the private sector. The other 72% came from deficit-funded cash transfers from the government. Without that deficit spending, consumption would have been even weaker. It’s worth noting that social assistance has decelerated markedly ever since the 2008-09 recession (see chart at the beginning).
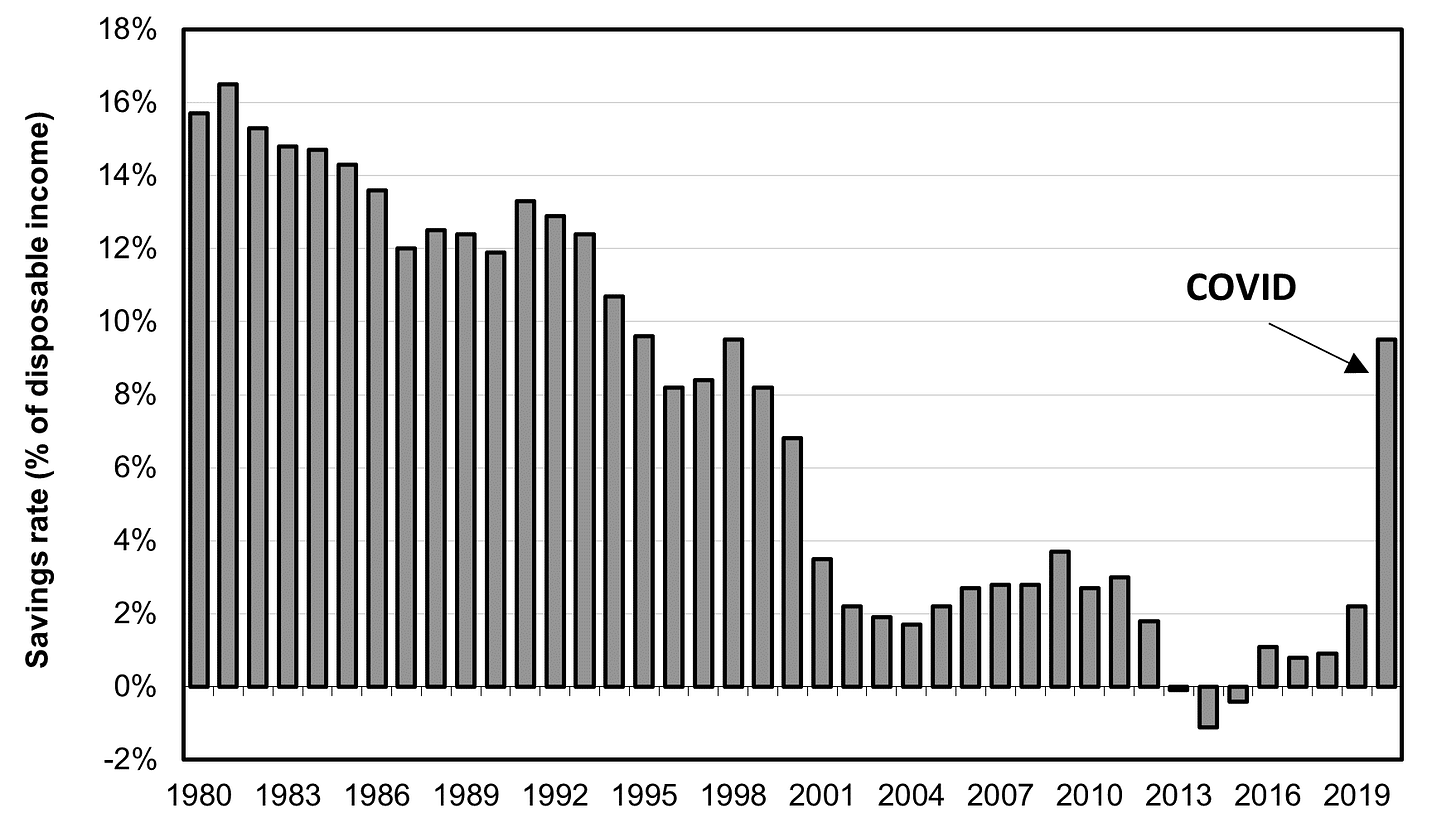
Finally, consumption would have been far weaker except that Japanese consumers virtually stopped saving. Increasingly, consumers began living hand-to-mouth. Back in the early 1980s, households saved about 16% of their disposable (after-tax) income. This gave rise to the myth that Japanese were culturally inclined to save. While the savings rate fell somewhat in the late 1980s, it plunged during the lost decades. It even turned negative during 2013-15 and then averaged a meager 1% during 2016-18. COVID temporarily sent savings back up in 2020 (see chart below).
Toyo Keizai ran a longer piece on this in Japanese and English.


Question: When you say that the "consumption share of GDP fell 3%" does this include the tax increase? What I'm asking... if you count the tax at 10% -- the money coming from the buyers could go up from 1x to 1.07x, but the money going to the sellers goes from 1x to 0.97x.
Thus the amount of spending has risen while the money to retailers has fallen (the balance going for taxes).