Is Aging Behind Japan’s Drop in Consumer Spending?
Temporary Kindle Discount on My New Book
Source: https://www.stat.go.jp/english/data/sousetai/2022n/zuhyou/s04.xls
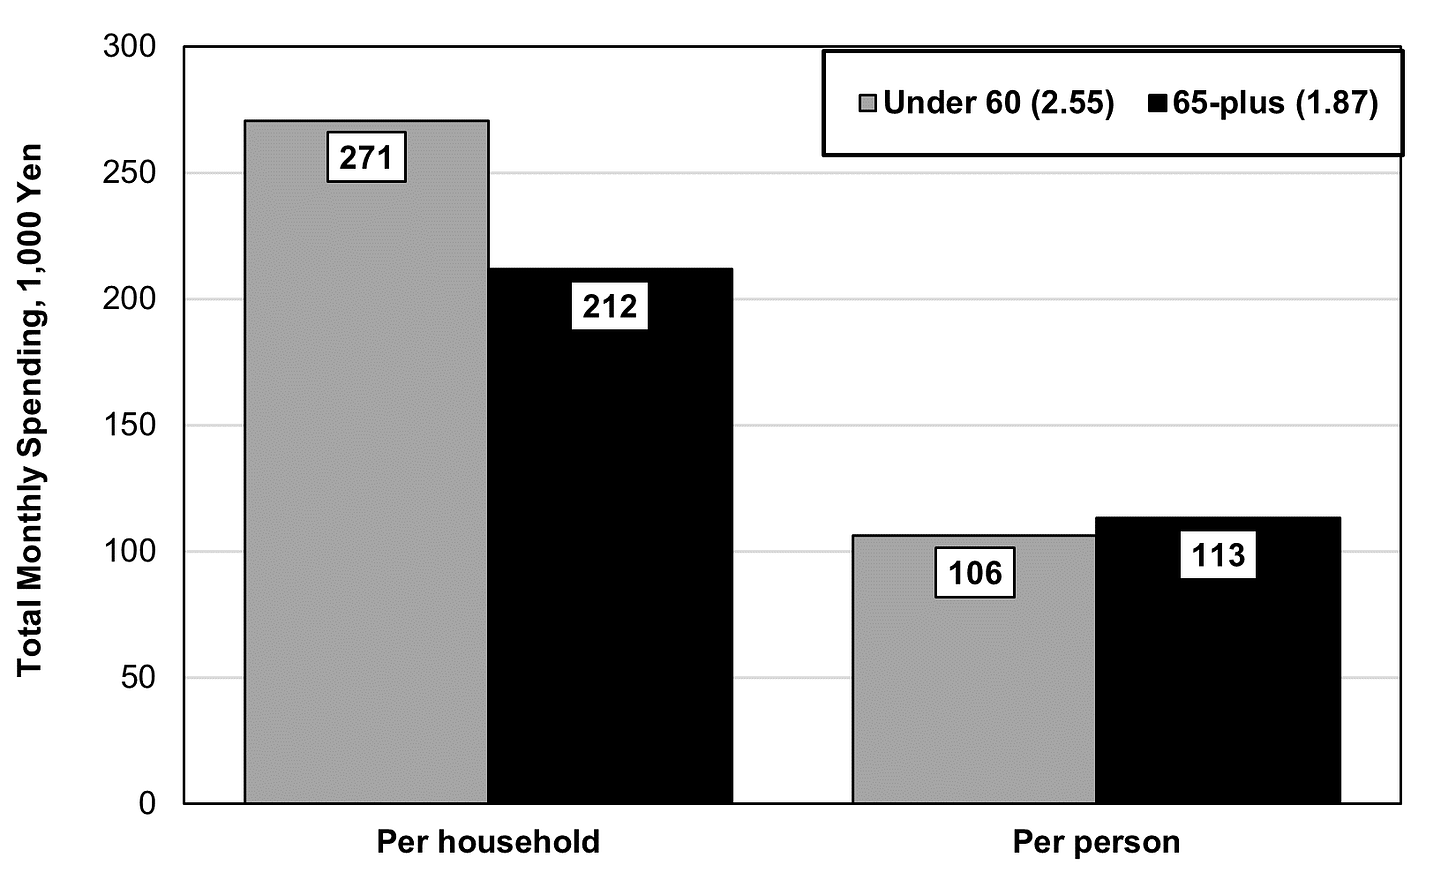
Note: The numbers in parentheses in the legend—2.55 and 1.87 respectively—are the number of people per household; 2022 data
In response to a recent post, a reader suggested that aging could be the biggest factor behind the decade-long drop in consumer spending. Older people spend less, he contended. Intuitively, that sounded right, so I looked it up. It turns out not to be true.
First, let’s recall the dismal record of household consumption. For the past decade, consumer spending is down 3% from its 2013 level even though GDP has risen 5% (see chart below). Spending was flat during 2013-19 and then fell following the 2019 tax hike, Covid, and rise in inflation.
Source: https://www.esri.cao.go.jp/jp/sna/data/data_list/sokuhou/files/2023/qe233/tables/gaku-jk2331.csv
What is the role of aging in this process? First of all, the share of households led by someone aged 65 or older has risen from 38% in 2012 to 45% in 2022. Moreover, as seen in the chart at the top of this post, senior households in 2022 spent 21% less than households led by someone under age 60. That would seem to support the reader’s contention.
However, we cannot stop there. We have to look at the number of people per household. After all, just as we look at GDP per capita, we need to look at consumption per capita. On average, under-60 households have 2.55 persons per household, whereas senior households have just 1.87. As a result, seniors actually spend about 7% more per person (see again top chart).
When I pointed this out on a Facebook dialogue, there was pushback. People couldn’t believe it and reasonably asked; what do older people spend their money on? And, with lower income, how can they afford to do that? The answer to the second question is that they draw down their savings.
As to the first question, it’s largely a matter of economies of scale. For example, rent, utilities, housing supplies, etc. cost almost the same whether there are two people or one person in a home. So, if two seniors live in a home and then one passes away, the cost per household stays pretty much the same, while spending per person immediately almost doubles. As the chart below shows, spending on housing, utilities, and various household supplies is less for a senior household than a younger household, but more per person in those households. These expenses amount to 20% of all spending per person in an under-60 household and 22% per person for a senior.
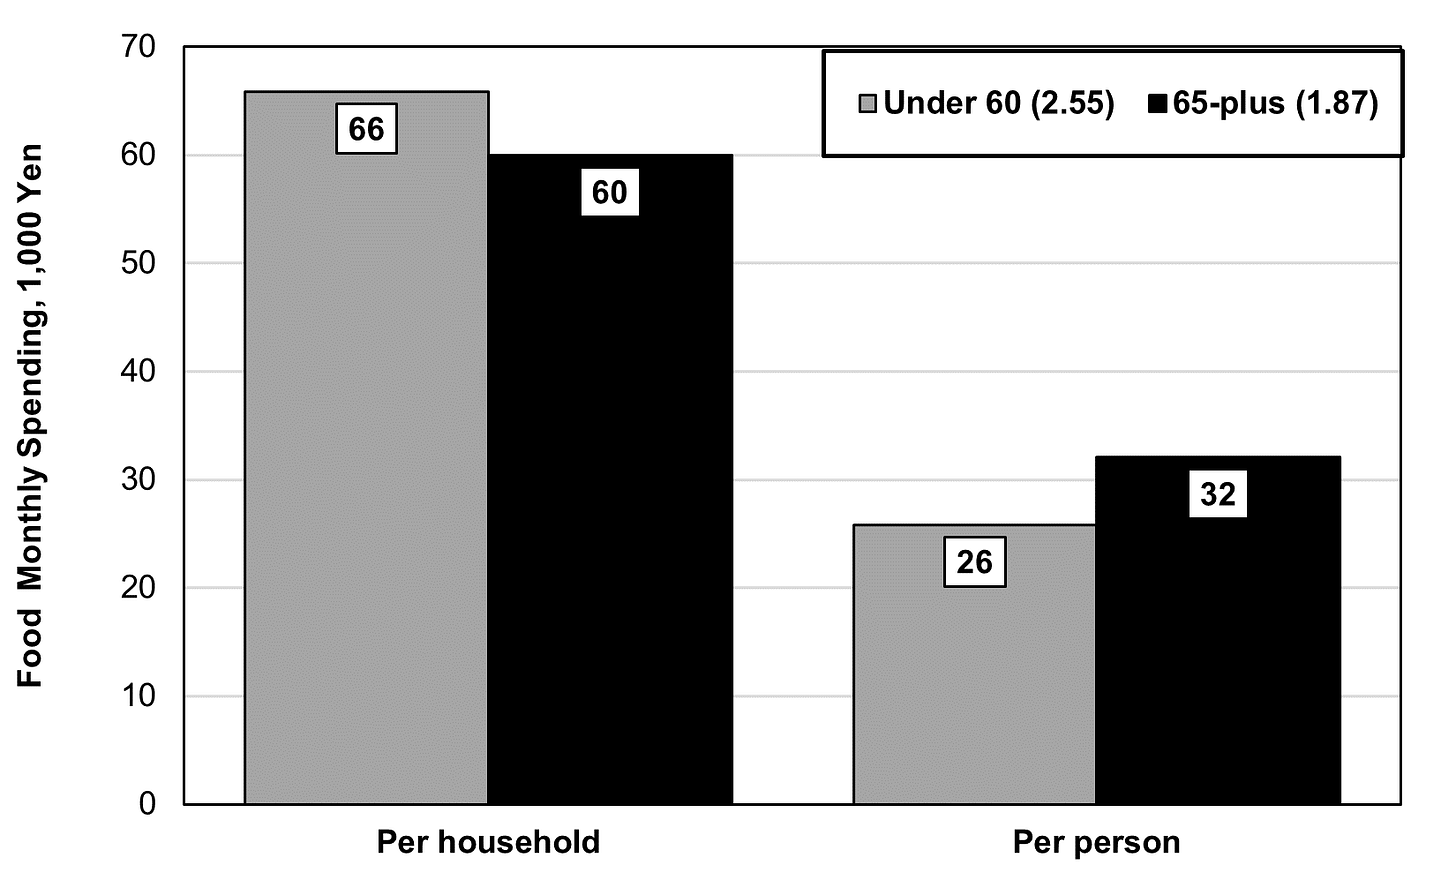
Food bought in packages for one often costs more than the same amount of food in a family-sized package. So, we get the same pattern (see chart below). Food amounts to 24% of spending per person in under-60 households and 28% in senior households. This share, by the way, is much higher than for other rich countries, a product of the high prices created by the government’s protection of farmers.
Out-of-pocket healthcare expenses are much lower than one would think because this does not include the spending paid for by insurance companies and the government. So, total healthcare spending is much higher for seniors, but they are not paying for it out-of-pocket. It amounts to 4% per person in under-60 households and 6% in senior households.
Seniors spend much more than younger households on inviting friends over for dinner, about the same on culture and recreation, and far less on educational expenses.
Overall, seniors devote about 77% of all their spending on basics: housing and related expenses, food, healthcare, and an “other” category which includes inviting friends over. Younger households devote 66% to these categories.
The bottom line: aging is not the cause of falling consumption. Part is due to an almost 2% decline in the number of people since 2013 and part is due to stagnant and/or falling income. Consumption per capita fell 1.3% from 2012 through 2022.
Discount on Kindle Version of My Book
Between now and December 12th, on Amazon’s American site, you can get a discount on a Kindle copy of my book. It will cost $17.99 compared to the regular price of $23.99. https://www.amazon.com/Contest-Japans-Economic-Future-Entrepreneurs-ebook/dp/B0CP2NSGNN/ref=sr_1_1?crid=140ZII2QW1ZKK&keywords=richard+katz+the+contest+for+japan&qid=1701451109&sprefix=%2Caps%2C60&sr=8-1 This discount is not available—at least not yet—on the Japanese or UK site, and I don’t know about others.
If you wish to get a hard copy, you can get a 30% discount by ordering directly from Oxford University Press. For details, see https://richardkatz.substack.com/p/30-off-for-my-book-on-japan-entrepreneurship


We ran a tapas and wine bar in Tokyo for several years. I can tell you that the ONLY people who spend in this country are Japanese over about 50 years old.
Even in low-price establishments, oh boy are younger people cheap glass and dish nursers.
Thanks for putting the numbers in perspective. A change in the denominator, the per capita figure in this case, certainly seems to make a big difference.
While I can appreciate your point as it relates to rent, I'm still struggling in terms of mortgage payments. Once a mortgage has been paid off later in life, then would not housing expenses be significantly reduced?