

The Weak Yen Reflects Weak Japan
PPP vs. Market Value For The Yen, Part II
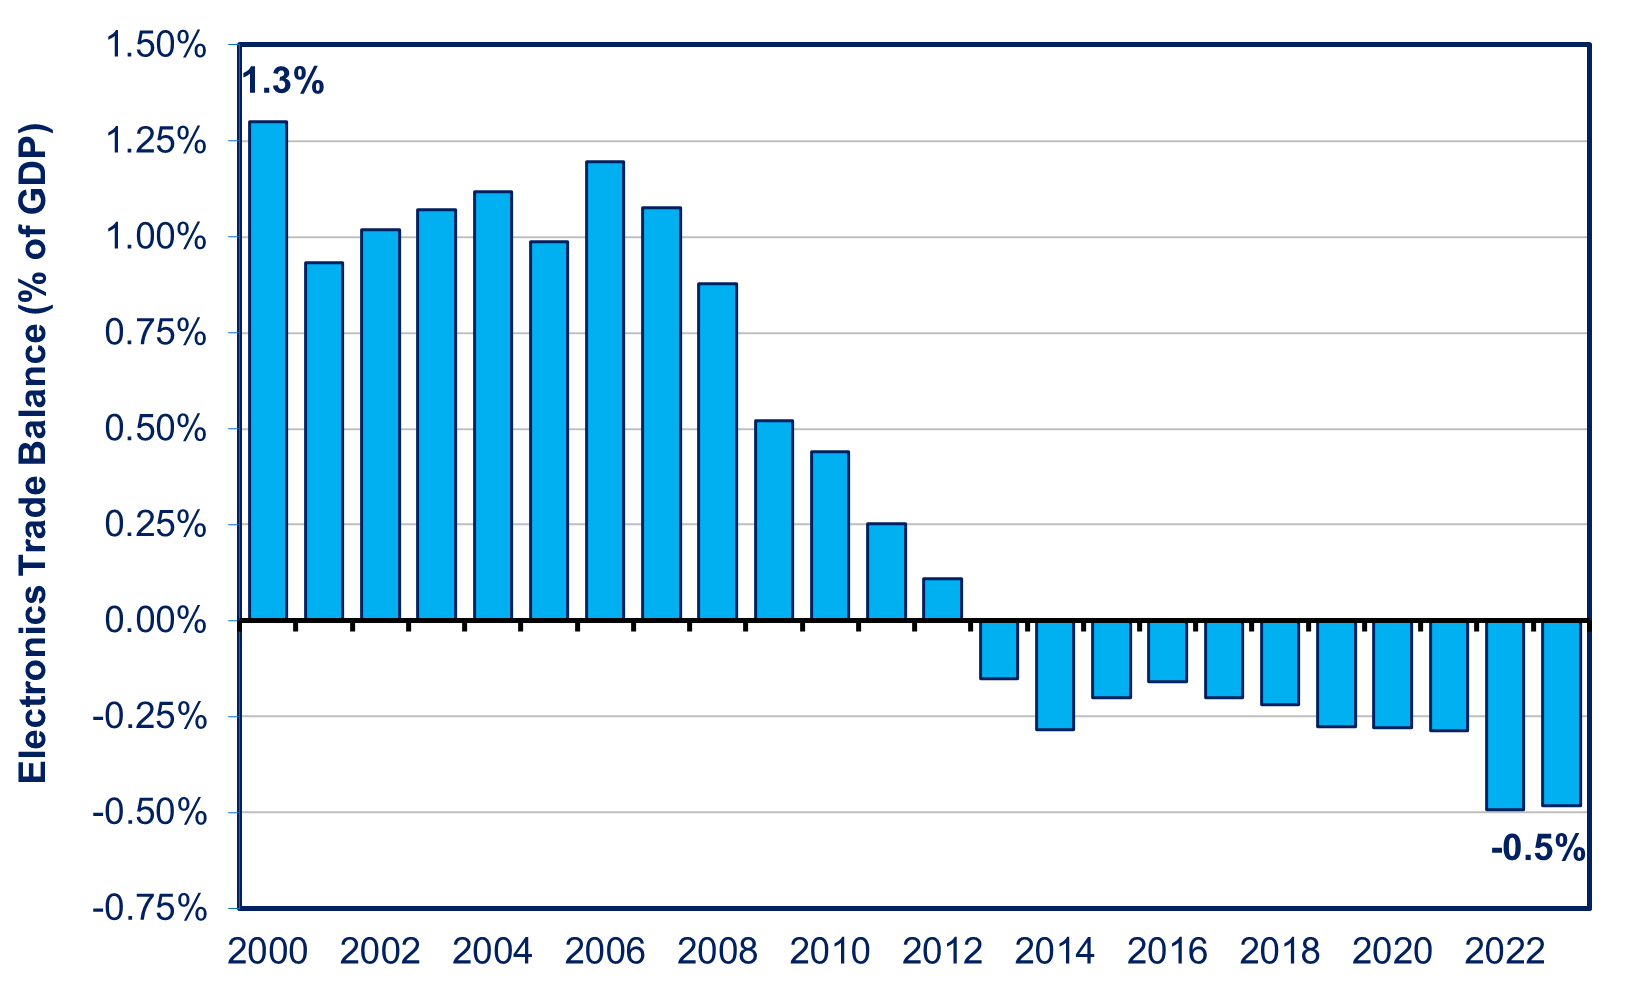
Source: https://www.jeita.or.jp/english/stat/electronic/ Note: Nominal GDP
Why The PPP Yen and Market Value Yen Differ
In a recent post, I discussed the assertion by some economists that the ¥/$ should move toward ¥95 because that is its Purchasing Power Parity (PPP). In fact, as I discussed, the PPP is a terrible predictor of the yen’s market value. In this post, I discuss why the market value has fallen so much even though the PPP value of the yen has doubled over the past four decades.
PPP is a “measuring stick,” an essential tool for making valid comparisons of some economic fundamentals among different countries. The PPP value of the yen is ¥95/$ because that is the level that makes the dollar price of a basket of goods and services— a car, a ton of steel, an auto repair, dry cleaning, etc.—cost the same in the US and Japan. PPP is indispensable to accurately comparing living standards, per capita GDP, labor productivity, and wages across countries.
By contrast, the market value of the yen is a price. Just like the price of a loaf of bread or a corporate share, it is the outcome of supply and demand. An automaker can only sell as many cars as people buy—no more, no less. If people buy fewer autos than car companies make, the companies have to lower their prices and/or make fewer cars. It’s the same with the yen. Its market value is the level at which the supply and demand for yen in international transactions equal each other. These transactions include not only trade in goods and services but also a host of financial transactions. When Japan exports a product, foreign customers have to change their currency into yen, thereby creating demand for the yen. When Japanese import a product, they must supply yen to buy dollars or other currencies. The same applies to financial transactions, such as purchasing and selling corporate shares. A falling yen reflects weakening demand not only for Japan’s products but also for its financial assets. That’s because the products have become less competitive, while financial assets offer low returns compared to those in the US, Europe, etc.
For example, when the Japanese government expanded its tax-free NISA accounts last year—in an effort to get the middle class to invest more of their savings in the stock market rather than just low-earning bank accounts—the majority of the NISA money went into foreign financial assets. This overseas investment added up to ¥10.4 trillion ($68 billion), an amount even greater than Japan’s trade deficit in goods and services last year. And even more NISA money is flowing out of Japan so far this year. Nomura Securities estimates that around half of the yen’s fall in 2024 was due to the outflow of NISA money.
The reason PPP can’t predict market value is that most items included in it have no role in international trade. At the same time, it leaves out the majority of items that are heavily traded internationally. The last occurs because PPP entirely omits financial assets, as in the NISA accounts. At the same time, PPP includes all of GDP. However, most items in GDP are not traded internationally. Houses, office buildings, and factories rarely cross the oceans. Neither do personal services, from haircuts to restaurant meals to home appliance repairs. Japan’s exports are almost entirely made up of manufacturing. Moreover, manufactured goods account for half of all imports—however, manufacturing accounts for only 20% of GDP. Fossil fuels and raw materials comprise a fifth of Japan’s imports, but Japan produces none of these, so they have no role in PPP.
Weak Yen Reflects Exporter’s Weakening Competitiveness
Just as an automaker or department store that is losing customers has to lower its prices to recapture them, so must Japan’s exporters. A cheaper yen is, in effect, a lower price.
From 1980 through 2010, despite a yen much stronger than today’s value, Japan ran a trade surplus in goods and services almost every year. The only exception was two years during the 1979-80 oil price shock. By contrast, ever since 2011, the country has run trade deficits every single year except for 2016-2017 (see chart below).

Source: World Bank’s World Development Indicators
Behind both the chronic trade deficit and yen weakness is exporters’ loss of competitiveness.
Take electronics, formerly one of Japan’s superstar industries. Back in 2000, Japan’s trade surplus in electronics equipment equaled 1.3% of GDP (see chart at the top of this post). That was equal to almost the entire trade surplus in goods and services that year: 1.5% of GDP. Then, however, Japanese companies stopped developing competitive versions of the new products that global customers wanted: mobile phones, tablets, PCs, Internet network equipment, the most-used computer chips, etc. And they could no longer charge premium prices for items like TVs. Consequently, Japan now runs an electronics trade deficit equal to -0.5% of GDP. That’s almost one-third of Japan’s entire trade deficit in goods and services: -1.5% of GDP.
Japan’s auto industry still runs a massive trade surplus. However, to maintain that surplus, automakers need a weaker yen. Back in 2007, Japan’s trade surplus in motor vehicles equaled 2.5% of GDP at a time when the yen was at ¥118/$. Then, in 2014 and 2019, the surplus fell to 1.9%. In 2024, the surplus recovered to 2.7% of GDP, but a large part of the reason is that the yen had weakened all the way to ¥151 (see chart below)
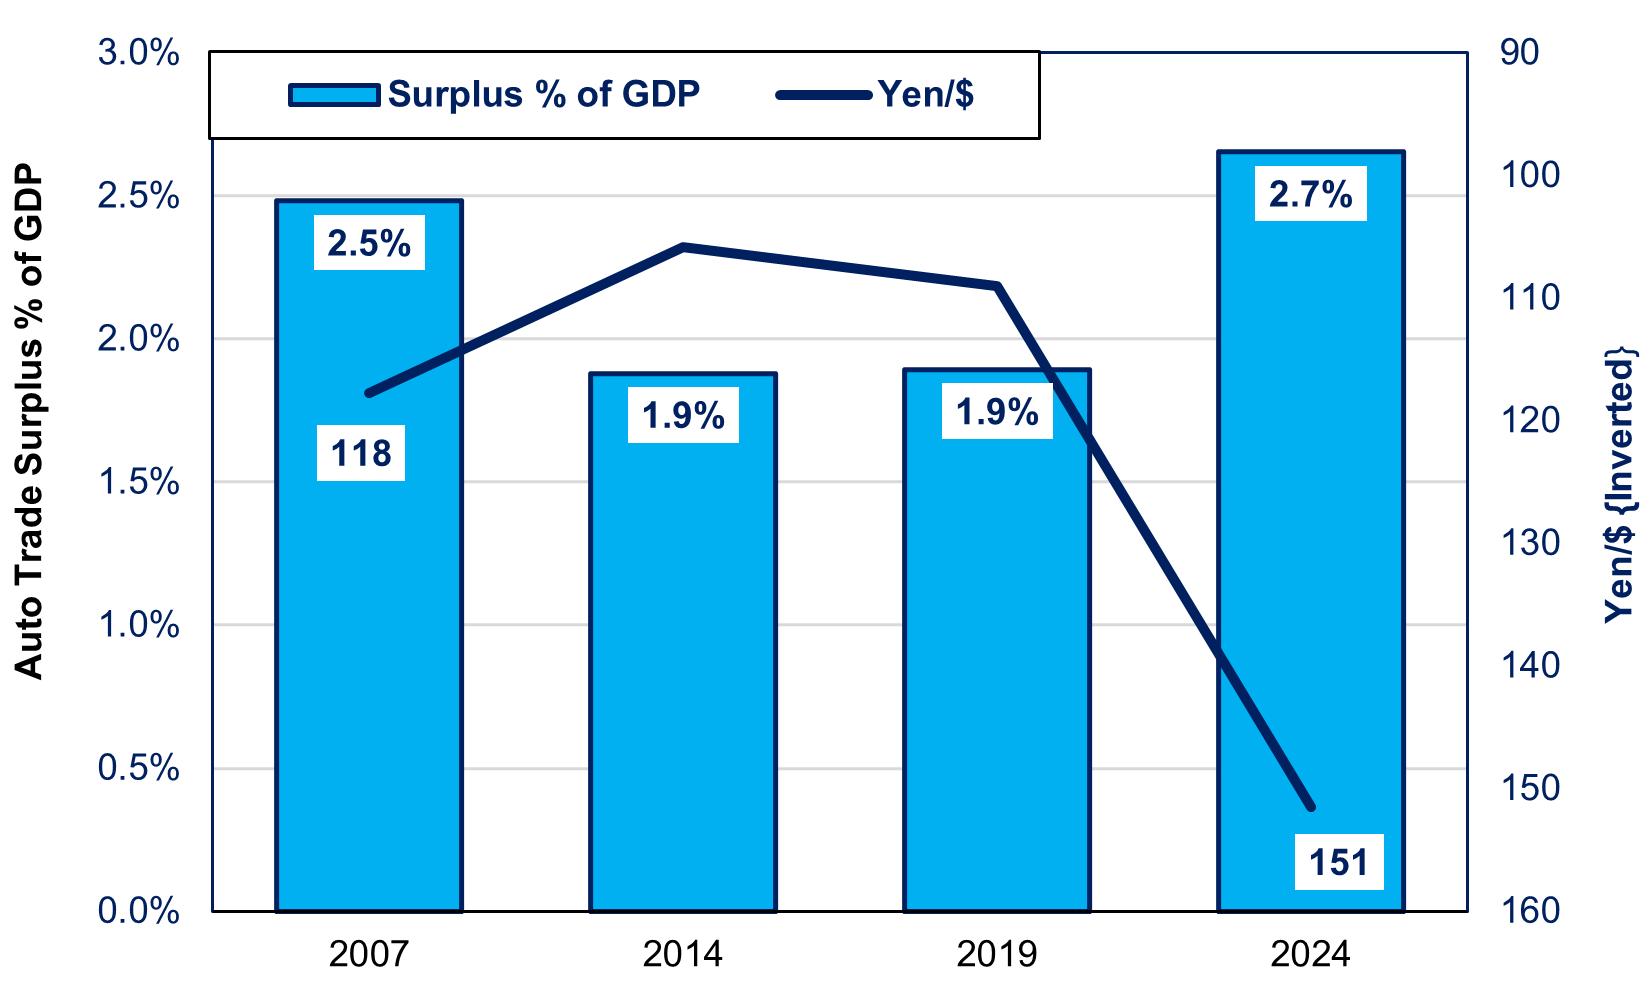
.Source: http://www.e-stat.go.jp/SG1/estat/OtherListE.do?bid=000001008852&cycode=1 Note: The yen/$ axis on the right is inverted to show that a higher number means a weaker yen
Also, with the rise of Electric Vehicles, the risk is that autos might suffer something akin to the fate of electronics. Already, Japan has lost to China its longstanding status as the world’s largest auto exporter, and China’s lead is growing (see chart below).

Source: For Japan, https://jamaserv.jama.or.jp/newdb/eng/index.html For China, assorted press reports
One million of China’s auto exports last year were battery-powered electric vehicles, 60% of which were sold in high-income countries, up from a mere 5% in 2018. China is no longer selling no-frills, poorly-made “Econoboxes.” The average export price of a Chinese EV has risen to $23,000, even higher in rich countries. Japan is barely competing in this growing market.
Some observers try to discount this evidence by pointing to items—like small electric motors for cars, certain types of advanced sensors, and carbon fiber—where Japan has a dominant global market share of 50% or more, sometimes even 100%. However, these are almost entirely niche products where global sales are typically tiny: an average of just $200 million. I discuss this in detail in Chapter 4 of The Contest for Japan’s Economic Future.
Occasional bouts of high prices for imports of raw materials can also worsen the trade deficit from time to time. In 2022, due to Covid and Ukraine, high prices for raw materials, as well as a weak yen, led to a 42% increase in imports compared with the previous year and resulted in an explosion of the trade deficit (see chart on “Nominal Trade Balance” above). While all importing nations suffered from the price hike in food, energy, and raw materials, the weak yen made Japan's price jump even higher. With food accounting for 26% of household spending, and the import content of food very high, a weaker yen takes a bigger bite out of the family budget. See the chart below showing how the hike in the price of imports in yen terms overwhelmed the price hike in the contract currency, e.g., dollars, euros, etc. In short, while global prices rose 27%, yen prices for Japan’s imports soared by 66%. A weaker yen means it takes more yen to buy the same amount of food or oil as before. Imported inflation was a major factor in falling real wages over the past three years and has led to political pressure to try to keep the yen from weakening even more.

Source: Bank of Japan
The Digital Deficit and Tourism
When people think of the trade balance, many focus only on goods, from cars to foodstuffs and oil. But services are an increasingly important part of international trade. One of the most important these days is trade in digital services, like the “cloud,” software, search platforms, digital advertising, streaming services, AI, and digital intellectual property (e.g., licensing patents). I have often referred to Japan’s poor performance in the use of digital technology. One reflection of this weakness is that, in 2024, Japan’s trade deficit in digital services reached more than ¥6 trillion ($40 billion), or 1% of GDP. That’s triple the deficit ten years ago. By contrast, the rest of the rich countries--US, UK, and EU (except for Ireland) ran digital surpluses. METI (Ministry of Economy, Trade and Industry) foresees the digital deficit rising to ¥10 trillion in the coming years, eventually surpassing the ¥11 trillion Japan pays for oil. Barclays Bank reported that, “the digital deficit has become a structural factor in the depreciation of the yen.” Mizuho Research Institute estimated that doubling the deficit from the 2023 level could cause the yen to weaken another 5-6 points vis-à-vis the dollar.
The weak yen has lured millions by lowering the cost of traveling to Japan and spending there. In 2024, net income from tourism (including purchases in Japan) reached a record ¥5.9 trillion ($39 billion), about 1% of GDP. But it has taken the weak yen to lure tourists to Japan rather than elsewhere. In this case, I’ve used the “real effective yen” to give a better picture of the market value of the yen compared to tourists’ own currencies, as it affects tourists from Korea, China, and Taiwan. The latter accounted for 60% of all tourists, and the Chinese spent the most. The “real effective yen” is the trade-weighted yen vis-à-vis all trading partners, and it adjusts for changing prices in all countries relative to price changes in Japan. As the yen depreciated, more tourists came to Japan and spent more while there (see chart below).
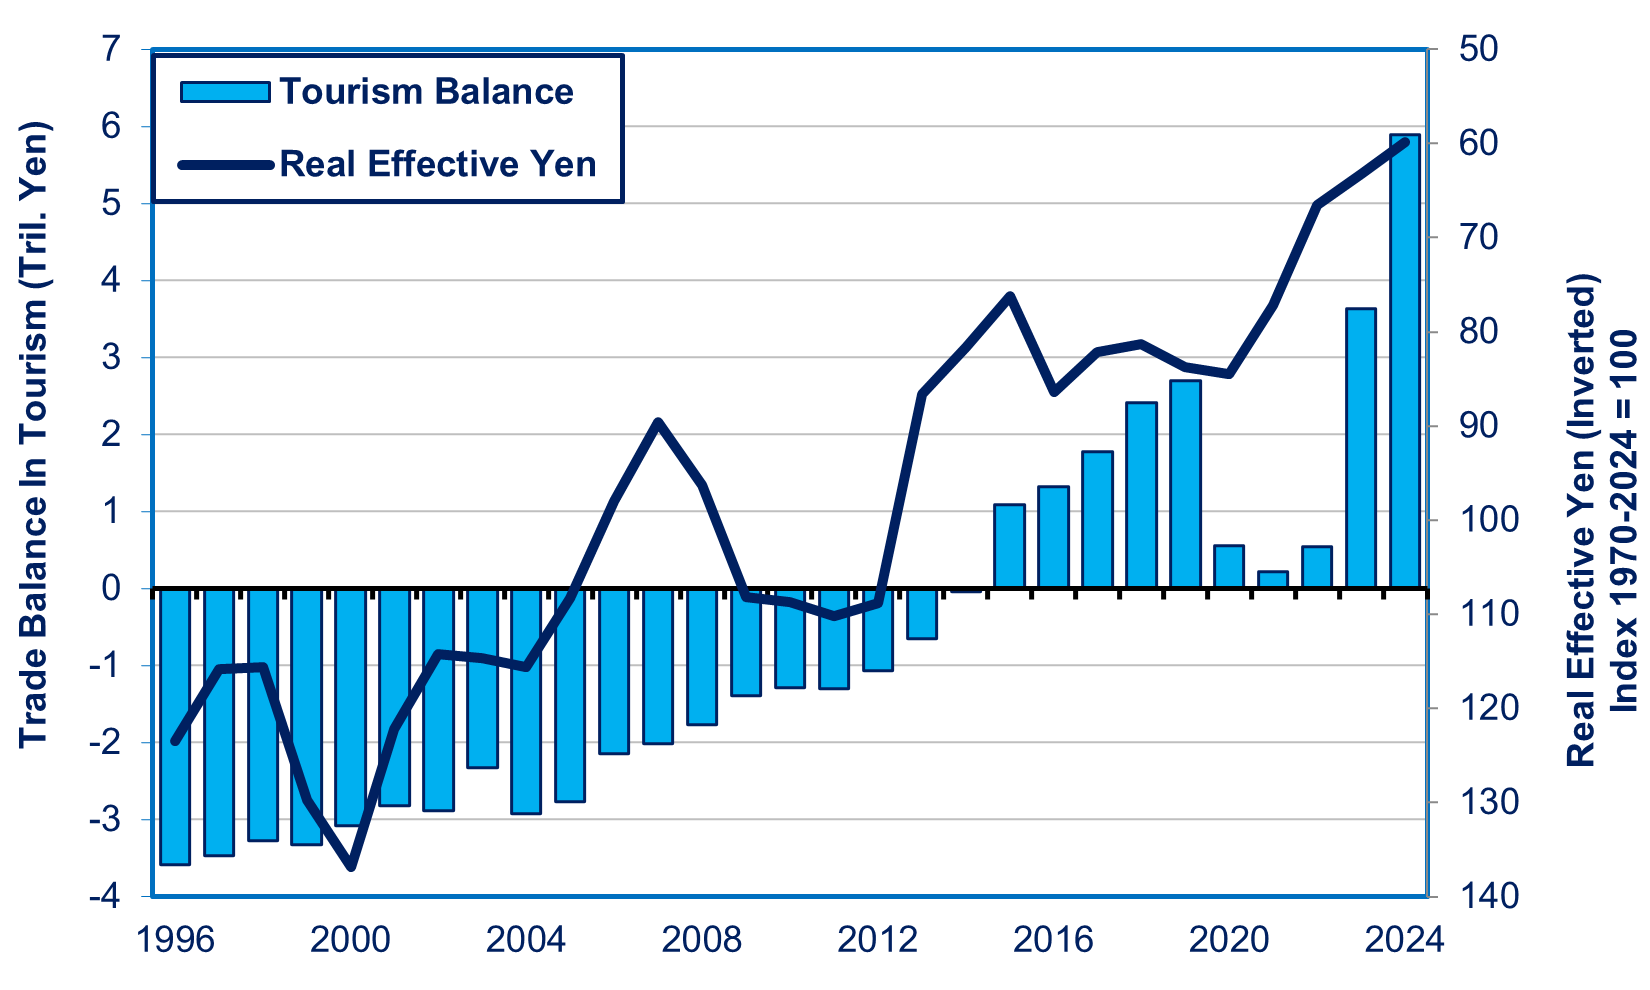
Source: Ministry of Finance for Tourism and Bank of Japan for real effective yen Note: see text for explanation of the “real effective yen.” The axis is inverted to show how a weaker yen draws in more tourists and leads them to spend more.
Coming Up
Financial transactions play at least as important a role as trade in goods and services in weakening the market value of the yen. I’ll discuss that in the next post on this topic.
Speaking in New York City
I’ll be speaking about my book on Feb. 24th at Columbia University in New York. For information and to register, see https://cjeb.business.columbia.edu/civicrm/event/info?reset=1&id=4

To receive new posts and support my work, consider becoming a free or paid subscriber.
To provide more support, donate several subs at $50 each. You do not need to name the sub recipients, just how many. This is a one-time contribution; it does not repeat automatically. Please click the button below.